

Introduction
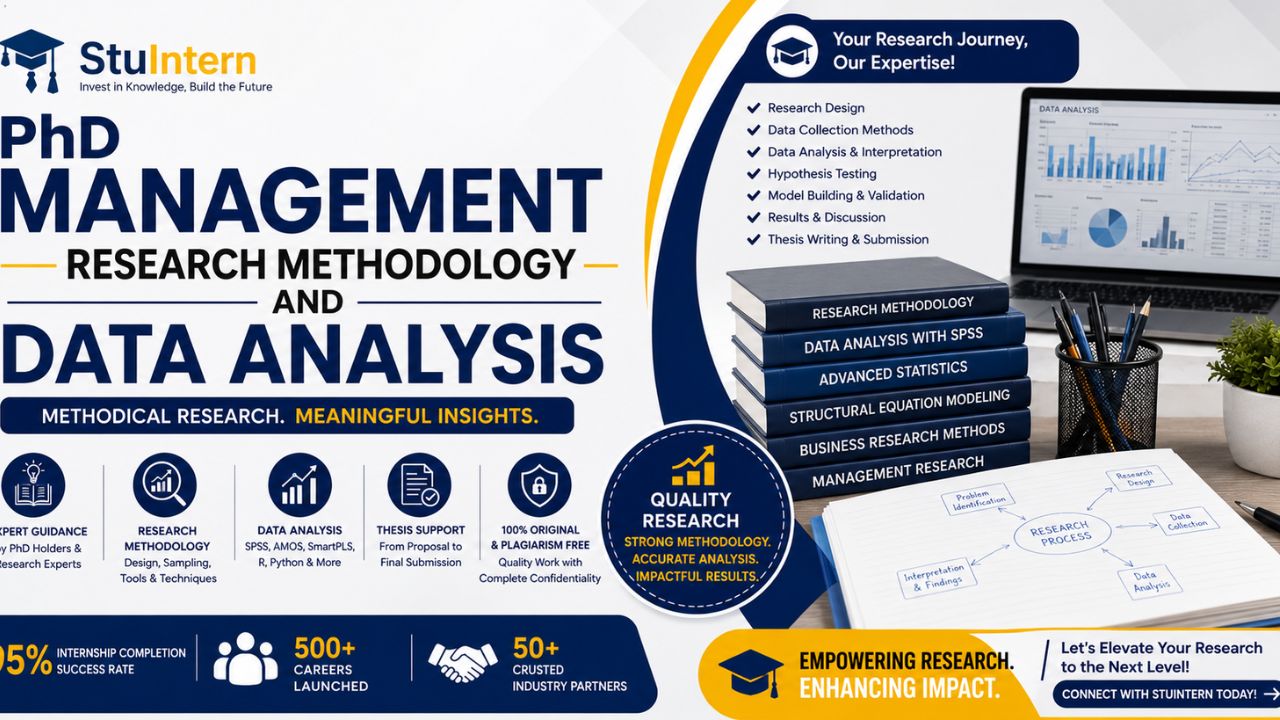
A strong PhD Management Research Methodology provides the foundation for conducting academically defensible research. Once a scholar has identified the research problem, research gap, objectives and questions the next major task is deciding how the research will actually be conducted.
Methodology is not simply a chapter describing questionnaires or statistical software. It explains the logic behind the research design the selection of participants or data sources data collection procedures, measurement methods, analytical techniques and ethical considerations.
For Management scholars methodology may involve qualitative or mixed-method research.
The overall process can be represented as:
Research Problem → Research Questions → Research Design → Population → Sampling → Data Collection → Data Preparation → Analysis → Interpretation → Findings
StuIntern provides academic guidance to help scholars understand and organize these methodological stages.
What Is PhD Management Research Methodology?
Research methodology explains the approach used to answer the research questions.
A methodology chapter may address:
Research philosophy
Research approach
Research design
Research strategy
Population
Sampling
Sample size
Data sources
Data collection
Measurement
Research instruments
Data analysis
Reliability
Validity
Research ethics
The methodology should be logically connected to the research objectives.
Why Methodology Is Important
Consider the following relationship:
Research Question
↓
What needs to be investigated?
↓
Research Design
↓
How will it be investigated?
↓
Data Collection
↓
What evidence is required?
↓
Data Analysis
↓
How will the evidence answer the research question?
If these components are not aligned the resulting research may struggle to provide answers.
Step 1: Identify the Research Approach
Management research commonly uses:
Quantitative Research
Uses data and statistical analysis.
Qualitative Research
Explores experiences, perceptions, meanings, processes and organizational phenomena.
Mixed-Methods Research
Combines qualitative approaches.
The choice should depend on the research problem and research questions.
Quantitative Research in Management
research can be useful when the researcher wants to measure variables and examine relationships or differences.
Common sources include:
Surveys
Questionnaires
Company datasets
Financial data
Structured databases
Potential analyses include:
statistics
Correlation
Regression
ANOVA
Factor analysis
Mediation
Moderation
Structural Equation Modeling
The analysis technique should be selected based on the research design and data.
Qualitative Research in Management
Qualitative research can be useful when the purpose is to understand experiences processes or complex managerial phenomena.
Methods may include:
Interviews
Focus groups
Case studies
Observation
Document analysis
For example a Management PhD could investigate how senior managers perceive the challenges associated with digital transformation.
The researcher may conduct -structured interviews and analyze the resulting data thematically.
Mixed-Methods Research
Mixed-method research combines qualitative evidence.
For example:
Quantitative Survey
↓
Measures employee engagement factors
↓
Qualitative Interviews
↓
Explore employee experiences behind the survey findings
A mixed-method design should be used when combining approaches genuinely helps answer the research questions.
Step 2: Select the Research Design
Research design provides the structure of the study.
Possible designs include:
Exploratory
Explanatory
Correlational
Experimental
Case study
Cross-sectional
Longitudinal
The appropriate design depends on what the research intends to discover or explain.
For example a study examining associations between culture and employee engagement may use a correlational design where appropriate.
Step 3: Define the Research Population
The population refers to the group relevant, to the research.
Examples include:
Employees
Managers
Customers
Entrepreneurs
SMEs
Banking professionals
Healthcare managers
Manufacturing organizations
The population should be clearly defined according to the research problem.
Step 4: Select a Sampling Method
A researcher may use probability or -probability sampling.
Probability Sampling
Examples include:
random sampling
Stratified sampling
Systematic sampling
Cluster sampling
Non-Probability Sampling
Examples include:
Convenience sampling
Purposive sampling
Snowball sampling
The selected method should be justified according to the research context and objectives.
Step 5: Determine Sample Size
Sample size should be determined using a rationale.
Depending on the design researchers may consider:
Population size
Expected effect
Statistical power
Number of predictors
Sampling strategy
Study design
Expected response rate
There is no sample size that applies to every Management PhD study.
Step 6: Develop the Research Questionnaire
Questionnaires are frequently used in Management research.
A questionnaire may contain:
Section A. Demographics
Examples:
Age group
Experience
Job role
Education
Industry
Section B. Independent Variables
For example:
Leadership
Organizational Culture
Work Flexibility
Section C. Mediator / Moderator
Where
Section D. Dependent Variable
For example:
Employee Engagement
Organizational Performance
Customer Loyalty
Questions should be linked to the conceptual framework and supported by appropriate measurement sources.
Step 7: Data Collection
Data can be collected through:
Primary Data
Surveys
Interviews
Focus groups
Observations
Secondary Data
Annual reports
Government datasets
Industry reports
Company records
Published datasets
Researchers should follow ethical requirements when collecting data from participants.
Step 8: Prepare the Dataset
Before conducting analysis the researcher may need to:
Code variables
Check missing data
Identify duplicate responses
Examine invalid responses
Review outliers where appropriate
Verify data entry
Prepare variables for analysis
Good data preparation reduces the risk of analytical errors.
Step 9: Descriptive Statistical Analysis
Descriptive statistics provide an overview of the dataset.
They may include:
Frequencies
Percentages
Mean
Median
Standard deviation
Minimum
Maximum
For example demographic analysis can describe the characteristics of respondents.
Descriptive statistics do not by themselves establish relationships.
Step 10: Reliability Analysis
When multi-item scales are used researchers may assess consistency.
One used measure is Cronbachs alpha.
Reliability analysis helps determine whether items intended to measure the same construct demonstrate internal consistency.
However reliability should be interpreted alongside evidence of measurement quality rather than treated as the only indicator of validity.
Step 11: Validity Assessment
Validity concerns whether the measurement and research design adequately represent the intended constructs.
Depending on the methodology researchers may consider:
Content validity
Construct validity
Convergent validity
validity
The specific assessment depends on the research instrument and analytical framework.
Step 12: Correlation Analysis
Correlation analysis can be used to examine the association between variables.
For example:
Leadership Support ↔ Employee Engagement
A correlation coefficient indicates the direction and strength of association.
However correlation alone does not establish causation.
Step 13: Regression Analysis
Regression analysis may be used to examine whether one or more predictor variables are associated with an outcome variable.
For example:
Leadership Support + Work Flexibility → Employee Engagement
Regression analysis can provide information about:
Coefficients
significance
Model fit
Explained variance
The assumptions and suitability of the model should be assessed before interpreting results.
Step 14: Mediation Analysis
Mediation examines whether an intermediate variable helps explain a relationship.
For example:
Leadership Support
↓
Organizational Commitment
↓
Employee Retention
Here organizational commitment may act as a mediator if the research design and evidence support such a model.
Mediation analysis should be theoretically justified than added solely to make the research model more complex.
Step 15: Moderation Analysis
Moderation examines whether the strength or direction of a relationship varies depending on another variable.
For example:
Leadership Support → Employee Engagement
with Work Environment potentially affecting the strength of this relationship.
The moderator should have a theoretical basis.
Step 16: Factor Analysis
Factor analysis can be useful when researchers need to investigate the underlying structure of measurement items.
It may help identify whether questionnaire items group into expected dimensions.
Researchers should consider:
Sample adequacy
Factorability
Extraction method
Rotation
Factor loadings
Interpretation
The selected procedure should match the research objectives.
Step 17: Structural Equation Modeling
Structural Equation Modeling (SEM) can be useful for Management research models involving multiple constructs and relationships.
A model may contain:
Latent variables
Measurement relationships
Structural relationships
Mediators
Moderators
SEM should be selected when the research questions, theoretical framework, measurement model, sample and data support its use.
SPSS for Management Research
SPSS is widely used for data analysis.
Depending on the study it can support:
Data cleaning
statistics
Reliability analysis
Correlation
Regression
t-tests
ANOVA
Factor analysis
The software itself does not determine the correct statistical method.
The researcher should first establish the research question and analytical requirements.
AMOS for Management Research
AMOS can be used for Structural Equation Modeling applications.
It can help researchers analyze
Measurement models
Structural models
Relationships between latent constructs
Model fit
For example a Management research model may examine relationships among:
Leadership → Employee Engagement → Organizational Performance
The appropriate model must be supported by theory and research design.
SmartPLS for Management Research
SmartPLS can be used for Partial Least Squares Structural Equation Modeling (PLS-SEM).
It may be appropriate for research models involving:
Latent constructs
Complex relationships
Mediation
Moderation
Predictive objectives
The decision to use PLS-SEM should be based on justification.
Choosing Between SPSS, AMOS and SmartPLS
The choice should follow the research design.
Research Requirement
Potential Tool
Descriptive statistics
SPSS
Reliability analysis
SPSS
Correlation
SPSS
Regression
SPSS
Factor analysis
SPSS
SEM applications
AMOS
PLS-SEM
SmartPLS
Complex mediation models
AMOS / SmartPLS depending on design
Moderation
SPSS or SEM software depending on methodology
These are examples, not automatic recommendations for every study.
Data Interpretation
Data analysis produces qualitative outputs but interpretation explains what those outputs mean.
For example:
Statistical Result
↓
Variable A is positively associated with Variable B
↓
Interpretation
Higher levels of Variable A are associated with levels of Variable B in the studied sample.
↓
Literature Comparison
Compare the finding with research.
↓
Management Implication
Explain what the finding may mean for organizations.
Interpretation should remain consistent with the research design. Should not make unsupported causal claims.
Writing the Results Chapter
A Management thesis may organize the results chapter as follows:
4.1 Purpose of the chapter.
4.2 Respondent Profile
Demographic information.
4.3 Descriptive Statistics
Overview of research variables.
4.4 Reliability and Validity
Measurement assessment.
4.5 Correlation Analysis
Associations between variables.
4.6 Regression / Hypothesis Testing
Testing the proposed relationships.
4.7 Mediation / Moderation / SEM
Where relevant.
4.8 Summary
Key findings related to the research objectives.
Tables should be numbered consistently. Explained in the accompanying text.
Writing the Discussion Chapter
The discussion should answer:
What do the findings mean?
A useful structure is:
Finding
↓
Comparison with Previous Research
↓
Possible Explanation
↓
Theoretical Implication
↓
Management Implication
For example if leadership support is associated with employee engagement the researcher can compare the result with studies and discuss what the finding may mean for organizational leadership practices.
Common Methodology Mistakes
Choosing Software Before Choosing the Method
The research question should determine the methodology, not the availability of software.
Using Many Statistical Tests
More tests do not automatically make research stronger.
Poor Questionnaire Alignment
Questionnaire items should correspond with the constructs in the framework.
Ignoring Assumptions
Statistical methods often have assumptions that should be assessed before interpretation.
Confusing Correlation, with Causation
An association does not automatically prove that one variable causes another.
Insufficient Methodological Justification
Researchers need to explain why they chose a design, sample, instrument or way of analyzing data.
How StuIntern Supports Research Methodology and Data Analysis
StuIntern offers help for Management scholars who are working through research methodology and data analysis.
Help might involve:
Choosing a research design
Using methods
Using qualitative methods
Planning mixed-methods studies
Finding a population
Deciding on a sampling strategy
Planning how many people to include in the sample
Guidance on creating a questionnaire
Preparing data
Guidance on using SPSS
Guidance on using AMOS
Guidance on using SmartPLS
Checking reliability
Checking validity
Looking at correlations
Doing regression
Analyzing mediation
Analyzing moderation
Guidance on SEM or PLS-SEM
Explaining statistical results
Organizing the results chapter
Developing the discussion
The goal of academic support is to help scholars understand their methods and analysis choices while keeping them responsible for their own data, research design, analysis, interpretation and final conclusions.
A Complete Management Research Methodology Roadmap
Research Problem
↓
Research Questions
↓
Research Approach
↓
Research Design
↓
Population
↓
Sampling
↓
Research Instrument
↓
Data Collection
↓
Data Preparation
↓
Descriptive Analysis
↓
Reliability / Validity
↓
Inferential Analysis
↓
Interpretation
↓
Findings
↓
Discussion
↓
Research Contribution
Frequently Asked Questions
What research methodology is best for a PhD in Management?
There is no best methodology. The right approach depends on the research problem the goals, the questions the theory, the data needed and the research setting.
Is SPSS for a Management PhD?
SPSS can handle quantitative analyses but some studies might need other methods or tools. The right tool depends on the research design.
When should AMOS be used?
AMOS might be suitable for some Structural Equation Modeling projects where the theory and models support SEM.
When is SmartPLS suitable?
SmartPLS can help with PLS-SEM for studies where that approach is properly justified.
What is the difference between methodology and data analysis?
Methodology explains how the research is set up and carried out. Data analysis explains how the collected data is processed and examined to answer the questions.
How should statistical results be interpreted?
Results should be explained in connection to the research questions the hypotheses, the theory, past studies and the limitations of the chosen research design.
Conclusion
A strong PhD Management Research Methodology sets the base for meaningful research. From the design and sampling to the questionnaire, data collection, analysis and interpretation each decision should connect to the research problem and the goals.
The process can be described as:
Research Problem → Research Questions → Design → Sampling → Data Collection → Data Preparation → Analysis → Interpretation → Findings → Discussion
Whether the study uses SPSS, AMOS, SmartPLS, qualitative methods or a mix of methods the tools and techniques should follow the research methodology of replacing the reasoning behind the methods.
StuIntern helps Management scholars with support, across research design, sampling, questionnaire development, statistical analysis, interpreting results organizing findings and writing the thesis.
Take the Next Step with StuIntern
Website: www.stuintern.com
Call / WhatsApp:+91 96438 02216
Need guidance with your PhD Management methodology or data analysis? Connect with StuIntern for structured support in research design, sampling, questionnaire development, SPSS, AMOS, SmartPLS, statistical analysis, interpretation, and thesis results preparation.